The Click Map is a visual reporting tool in Mailercloud that shows how recipients interact with the links in your email campaigns. It highlights exactly where users clicked, giving you a clear picture of which parts of your email captured the most engagement.
With this feature, you can:
View click activity directly on your email layout
Analyze total vs. unique clicks per link
Understand subscriber behavior and preferences
Improve future campaign performance based on real interaction data
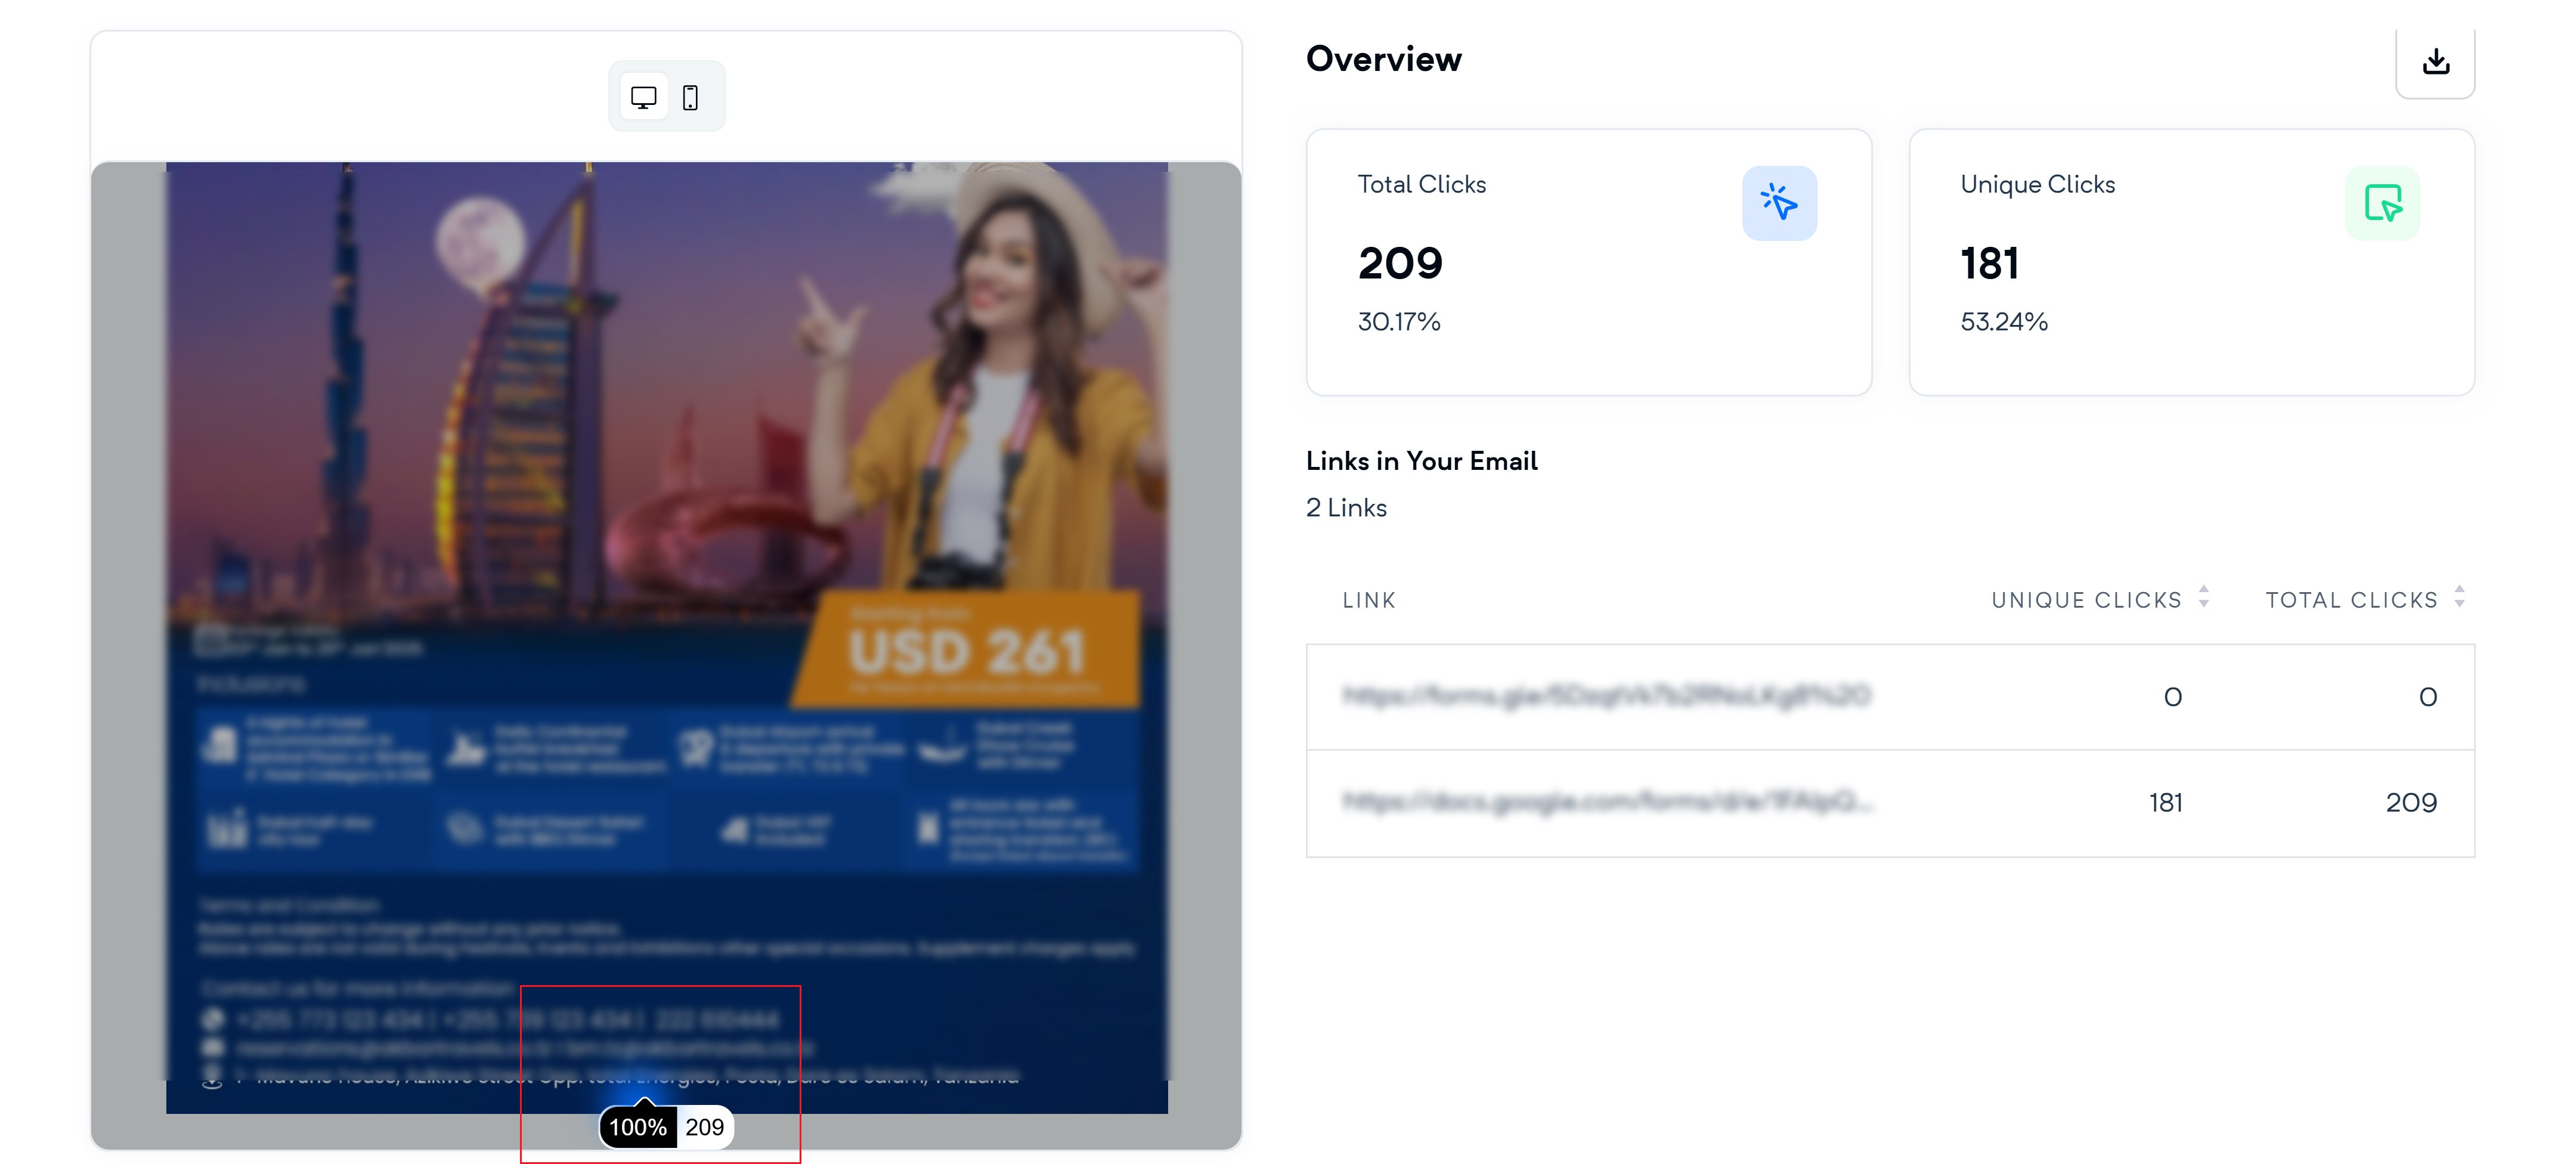
View your email design with clickable overlays showing exactly where recipients clicked. Easily identify high-performing areas in your email layout.
Total Clicks: The total number of times a link was clicked (including repeat clicks).
Unique Clicks: The number of individual recipients who clicked the link at least once.
Hover over any link in the link list to instantly see its position in the email layout. This makes it easy to identify which links got attention and where they appeared in the message.
Access recipient-level data, including:
Who clicked a specific link
The timestamp of each click
Use this insight to better understand subscriber behavior and improve targeting strategies.
Go to Reports
After sending your campaign, navigate to the Reports section of your Mailercloud dashboard.
Select a Campaign
Click on the specific email campaign you want to analyze.
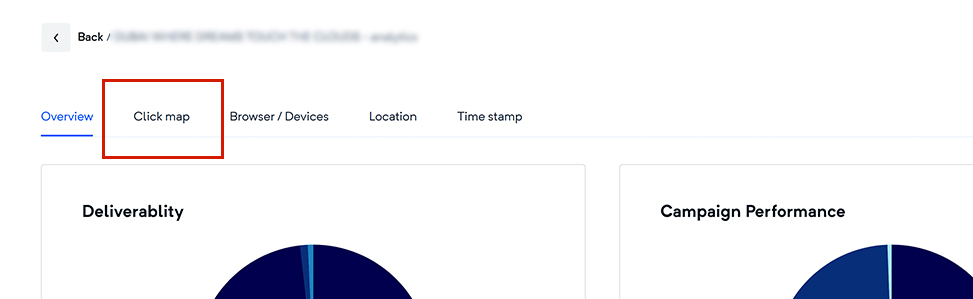
Open the Click Map
Inside the campaign report, locate and click the Click Map tab to view the visual engagement breakdown.
Optimize content and CTA placement based on real interaction data.
Identify what’s working and what’s being ignored.
Make informed decisions to improve email design and performance.
Need help interpreting your click map results? Contact our support team anytime.